features
Where is the bottom?

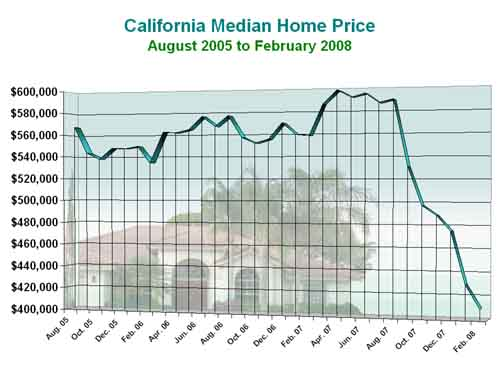
Median home prices in Los Angeles reached a peak in August 2007. By February 2008, prices had dropped 16.5%. Homeowners, investors, realtors, homebuyers, builders, mortgage companies, banks and everyone working in any industry dependent upon home sales and construction want the answer to the same question…”Where is the bottom?”
Word on the Street
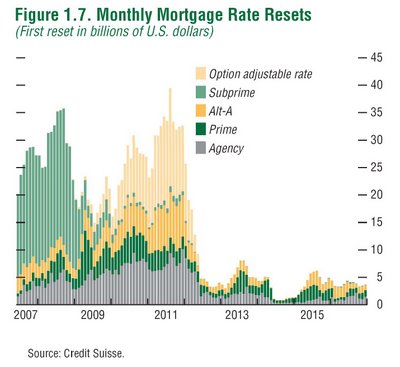
There is a lot of noise about the housing market. TV commentators, newspapers and water cooler chatter…everyone has an opinion about when we hit bottom. Some of the predictions seem to be predicated upon hard data. See the nice chart below that clearly shows that 2008 will bring an end of the huge wave of subprime loan adjustments causing all of these foreclosures.
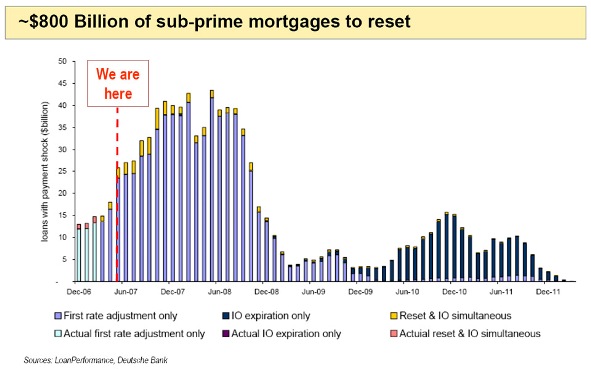
Note: this chart was from June 2007. So we are “not here” but two-thirds of the way through the bulk of the ARM adjustments depicted in the chart.
Based upon this information, one could argue that home prices might bottom in 2009. That was the interpretation of Lawrence Kudlow on his CNBC politics and economics show, Kudlow & Company, on April 16, 2008.
As the Federal Reserve steps in to cut interest rates and bail-out financial institutions crippled by the credit crunch, the stock market rallies, and commentators pronounce that the market is a lead indicator that the home price bottom is only 6 months away.
Even on the front line, I see anecdotal evidence that the bottom is near. More and more investors are applying for financing to pick-up bargains, and investors are forming numerous private money funds to get them the money they need. I hear talk everyday about the bargains to be had in bank-owned properties, foreclosures, short-sales and rehab flips. Surely, investors are on the sidelines just waiting to jump in at the bottom. Meanwhile, home sellers are stubbornly resisting lowering their asking prices because the bottom must be right around the corner. Moreover, Fannie Mae and Freddie Mac can now offer jumbo loans. “We are saved!”
Everybody is wrong.
The Facts
All of the empirical economic data predict that home prices will continue to drop for at least another 4 years. And, that is the optimistic forecast. Realistically, home prices will continue to decline for a total of 8 to 10 years. During this decline, home prices in Los Angeles will drop nearly 50% from their highs of August 2007. Robert Campbell, a leading California real estate economist, predicts that this will be the largest decline in home prices since we began keeping records in 1890.
Recent History
In order to fully explain why the home price downturn will be protracted, I must first give you a quick recap of how we got into this situation in the first place.
In 1988 US home price began to drop after a run-up fueled by Wall Street’s takeover of mortgage lending from sleepy old savings & loans. This drop continued for 9 years, until 1997 when median US home prices finally began to rise again.
In 2000, the Federal Reserve was concerned that the Y2K bug would seize the country’s computers, and the banking system would fail. As a safety measure, they flooded the economy with currency, and lowered interest rates. This had the unintended result of homeowners who were previously upside-down in their mortgages, flooding mortgage companies with applications to refinance into a better rate.
Three months later, the dot-com bubble burst, and the Federal Reserve, again concerned about the economy becoming disrupted, lowered interest rates again. This cheap money caused home prices to continue rising and caused even more refinancings.
A third crisis hit in 2003. 9/11. In the aftermath, the American consumer was paralyzed. GM couldn’t give cars away, and the Federal Reserve stimulated the economy with even more interest rate cuts. It worked. The economy didn’t stall.
However, home prices were now on an upward spiral fuelled by the perception that home prices always go up. They were also help by the availability of cheap money the Fed was pumping into the economy and easy credit terms. Everyone knew someone who was becoming rich just from owning a house. This caused a huge demand for new housing. As home prices continued to spiral upwards, people began to refinance just to take cash out of their homes to finance consumer spending. “Who cares? The house is just going to keep going up in value.” Homes had become personal ATMs.
The demand for home loans was so great that the mortgage industry and Wall Street had to hire a huge number of people to handle all of the processing. These were mostly twentysomethings with virtually no experience in mortgage lending, underwriting, securitization or risk analysis. They were told, “Let’s close these deals as fast as possible, and you’ll make a lot of money. Just copy what the guy next you is doing.”
Sure some well intentioned, smart people knew that home prices were unrealistically high, but they couldn’t do anything about it. If they refused to do the loans, their competitors would take the business instead. If a loan officer wouldn’t lend to a consumer, a different loan officer would. If a mortgage company would buy a portfolio of questionable loans, and different mortgage company would. If a ratings agency wouldn’t give an investment bank’s mortgage bonds a AAA rating, another one would. If a hedge fund manager didn’t give his investors the profits promised by these bonds, they would find another fund manager.
Why didn’t the regulators put the lid on things? In my opinion, the regulators were deliberately looking the other way. Everyone wanted this to happen: consumers, lenders and investors. There was no constituency asking for this to stop. Everyone was making money. Who is the injured party? In my experience, regulators who call for preemptive measures are usually shouted down, and ridiculed for predicting that the “sky is falling.” There is seldom political will to fix a problem until events actually achieve crisis levels.
The housing and mortgage markets were completely out of control.
By 2006, the mortgage industry had lent money to virtually every qualified borrower, but no one wanted the party to stop. In order to keep things going, lenders began to put the least qualified borrowers into the most risky loans, and they did this at a time when homes were at their absolute top value.
Wall Street simply stopped buying these bad loans, and more than 100 mortgage companies failed in the first three months of 2007.
It is these risky loans made during 2006 and 2007 that were the first to fail. These failures eroded the values of their neighbors’ homes and caused a domino effect of foreclosures. Moreover, these failures exposed that fact that ratings agencies were not properly evaluating the riskiness of these mortgage bonds, and called into question all bond ratings. All types of credit to froze up. It was August 2007, and the credit crisis had begun. Jumbo loans nearly vanished, and home values in Los Angeles (largely dependent upon jumbo home loans) began to tumble.
That brings us to today.
5 Reasons for Declining Home Prices
Here are 5 empirical reasons why home prices in Los Angeles will drop nearly 50% over the next 8 to 10 years:
1) The Easy Credit is Gone
2) The Recession
3) Housing Affordability Ratios
4) The A-Paper Loan Crisis (hasn’t happened, yet), and
5) Housing Bubble Symmetry
Much of the boom in housing prices was a result of easy lending terms offered by the mortgage industry. The biggest culprit was the stated income 100% financing loan. Virtually, anyone with a pulse could get into a home, without having to prove their financial responsibility or having to invest their own money into the home. Many borrowers deliberately misled lenders, by buying numerous homes under these terms claiming that each was a primary residence, when in fact they were purchased for speculation.
Over 100 mortgage companies have failed, and both Fannie Mae and Freddie Mac are technically insolvent.
The credit crisis has also caused a shortage of funds for jumbo mortgages, which comprise a major share of financings in the Los Angeles area.
Now that this easy money is gone, jumbo loans are scarce and people have to actually invest their own money and/or prove their financial qualifications, demand for homes has shrunken and home prices will continue to decline.
The housing boom financed the majority of growth in our nation’s Gross Domestic Product. Mortgage equity withdrawals (MEWs) measure the amount of money people took out of their homes to pay for consumption. During the previous housing cycles, MEWs financed only 12%-17% of the growth in GDP. During this housing cycle, 66%-100% of the growth in GDP was funded by people spending the equity in their homes. In other words, if people hadn’t borrowed against their homes to buy stuff, real growth in GDP would have barely achieved a 1% growth rate.
Homeowners have depleted much of their equity either because of MEWs or because of falling home values. So, they can no longer borrow against that equity to make new purchases.
The housing downturn means a loss in jobs in construction, real estate, related retailers, and service companies. With this loss of employment, and the loss of economic stimulation in other sectors financed by mortgage equity withdrawals, a recession is inevitable.
Unemployed people don’t buy new homes. Neither do people who can’t sell their homes because they are owe more than the house is worth. This contraction in demand will put further downward pressure on home prices.
Since World War II, median home prices in Los Angeles have averaged 4 times median income. This is what is normal for the area. The city has been running a housing price fever, though. At its peak, August 2007, median home prices was 10.5 times median income. To return to normal home prices must drop back to the normal 4 times median income.
The combination of low interest rates and easy credit caused an a-typical disconnect between income and home prices. Now that the conditions that caused this disconnect are gone, median home prices will inevitably return to their historic mean of 4 times median income. This implies up to a 57% drop in prices from the August 2007 high, with a small portion of this correction coming from a rise in income.
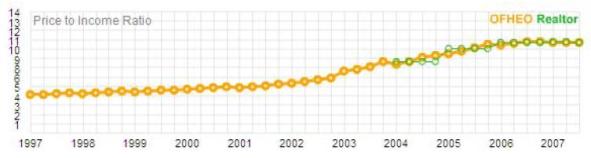
Los Angeles housing prices have reverted to this mean ratio of 4 times income after each of the last two housing bubbles: in the 70’s and the 80’s.
A lot of people are calling a bottom to housing prices in 2009. They are, like Lawrence Kudlow, looking at charts depicting the re-setting of sub-prime ARMs, and based upon the fact that the bulk of these resets will be over in 2008, predicting that the worst of the housing crisis will soon be over.
They are looking at the wrong chart.
There will be another wave of foreclosures caused by the re-setting of the Option-ARM products sold in 2006 and 2007. In a rising interest rate environment, it was one of the few ways to actually lower a borrower’s monthly payments. The resets on these loans will occur in 2010 and 2011, and they will set off a 2nd wave of foreclosures. This time, they will be A-paper foreclosures, and we will see significant foreclosures for the first time in affluent communities like Brentwood, Beverly Hills, Pacific Palisades, Encino, Calabasas, Bel Air and Malibu.
Communities already hit with the sub-prime foreclosures, like Sacramento, the Central Valley, Inland Empire, Palmdale, Lancaster and San Diego will have another round of foreclosures. This time it will directly affect A-paper borrowers who can’t refinance their Option-ARMS because falling home prices have left them with no value in their homes.
These 2010 and 2011 A-paper and Alt-A foreclosures will approach the same level of the sub-prime implosions that we are currently experiencing. For this fact alone, it is highly unlikely, that we will see a turn-around in home prices, before 2012, and as I’ll demonstrate next, there is a good reason to expect the decline to continue another 3 – 5 years beyond that.
Look again at a historical chart of US median home prices. You will notice that the housing price bubbles in the 1970s and 1980s were both symmetrical. That is to say that home prices decline over about the same number of years that it took for them to rise. In the 70s, the price pattern made a symmetrical chart pyramid, and in the 80s, it formed a nicely rounded mound. This isn’t good news, because this phenomenon predicts that the current downward slide in home prices will continue about as long as the price climb took. That price climb took 10 years. Since the peak in Los Angeles housing prices was in 2007, prices could decline until 2017.
Human nature being what it is, a lot of people reading this will say that this is a wild “end-of-the world” scenario, but let me remind you that the last decline in home prices lasted almost as long, for 9 years, 1988 to 1997.
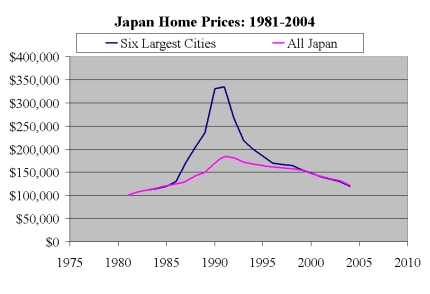
There is also another precedent for this long symmetrical decline. After a 14 year price decline in Japan, their housing market finally began to rebound in 2005
Housing price data since 1890 have been graphically incorporated into a clever roller coaster video. Watch the video below. It will give you a visceral sense the number of ups and downs of US home prices over the last 120 years, and of the current price decline. Pay special attention to the last part of the ride; it represents our current situation. If you still have any doubts about the direction the housing market is headed, it will make you into a believer.
Click here to open video window
Still in Denial?
The evidence is overwhelming, but human nature is what it is. Most people reading this will tell themselves that the market in general may act like this, but that their own circumstances are different. Unfortunately, there isn’t a strata of the housing market that is immune to these price pressures.
Demand for homes at all levels is interconnected. It’s a kind of food chain. In order for demand to be fueled at the top, there must be demand at the bottom, pushing everyone upwards. First-time home buyers must be able to afford and qualify for financing to purchase entry-level homes. This allows the sellers of these homes to use their equity to move up into a nicer neighborhood and a bigger home. That purchase, in turn, allows people in the middle of the market to climb their way into the best homes in the best neighborhoods.
Unfortunately, there are dislocations at all levels of the housing market. The 100% financing option was originally intended to help facilitate first-time home buyers gain access into the housing market has been greatly reduced. They are harder to obtain and offered by fewer lenders. The middle of the market has glut of inventory, from homeowners attempting to escape unmanageable payments and with banks trying to dump repossessed properties. Moreover, many of the loan products which allowed these consumers to purchase a home, no longer exist. It will take years of demand to absorb all of this excess inventory. Consequently, with no upward pressure on home price in the middle, demand from middle market homeowners trading up into premium neighborhoods will also subside. The top of the market isn’t already without its own problems. There is already a shortage of jumbo loan financing, and many middle-class people used the aggressive Option-ARM loan products to move into the best neighborhoods. When the maximum payments on these loans re-set in 2010 and 2011, there will be a rash of foreclosures collapsing prices in the best neighborhoods, as these overreaching, middle-class homeowners get a dose of financial reality, and their mortgages implode on them.
If this forecast were true, wouldn’t it be reported in the news media? Well, not necessarily. The first reason is that news organizations report events which have already occurred. They are not in the business of making predictions. The second reason you won’t see this forecast in the news is that the media gets its housing data from organizations that have an interest encouraging people to buy more houses: institutions like the National Association of Home Builders, the National Association of Realtors and big banks like Wells Fargo. Otherwise detailed economic reports from these institutions either avoid the topic completely or equivocate about the expected depth and duration of the housing downturn. The CEO of Wells Fargo was on TV yesterday. When the housing downturn was brought up, he began his reply by saying something like, “At some point, we will reach a bottom and housing prices will stabilize.” That’s a pretty vague response from someone collecting a huge paycheck from his shareholders to know the exact answer to that question. He was vague by design. If he went on national television and predicted the bottom was 10 years away, loan applications for new home purchases would immediately fall-off.
Stay Smart
To track how far home prices have to fall in a particular city, you can find price-to-income charts at Housingtracker.net and additional charts at MacroMarkets.com. Look for the 1997 price-to-income ratio, and compare that to the current ratio, and you will have a good estimation of how far home prices in that city have to fall. These charts can also tell you when home prices have reversed and started to rebound.

|
Drew de la Houssaye is an associate with THE BROKERAGE Real Estate Group Beverly Hills. Drew specializes in westside luxury real estate, renovations and probate sales. He blogs on Westside real estate, entertainment and local events. If you would like to contact him, he can be reached via twitter, facebook, LinkedIn or email. |
Leave a Reply
Recent Press
- Appeared on an episode of Bravo's hit reality real estate show – Million Dollar Listing Los Angeles – 12/1/2016
- Contributed a story about the 50th Aniversary of the Baldwin Hills Reservoir Disaster – Zocalo Public Square & KCRW Which Way LA – 12/13/2013
- Actor/Musician Rob Zombie lists his Hancock Park tutor mansion with THE BROKERAGE for $3.95 million – LATimes – 9/13/2013
- Profiled and Q&A – Trulia Luxe Living – 6/10/2013
- Guest Commentator Re: LeAnn Rimes' $3 Million Bargain in Hidden Hills and More – LA Times (Video) – 3/17/2013
- Quoted Regarding the Popularity of Luxury Homes with Basketball Courts – Radar Online – 3/4/2013
- Guest Commentator Re: Jeremy Renner's $24 Million Holmby Hills Estate and More – LA Times (Video) – 2/2/2013
- Contributed the article "Keeping it in Reserve" about an innovative way to engineer more affordable mortgage payments – The Scotsman Guide – February 2007
Testimonials
Search Site
You may also be interested in...
Luxury Homes for Sale
Luxury Condos for Sale
Property Search
Archives
LA Times Interview

Contact
|
Drew de la Houssaye (310) 903-7866 ph (310) 300-0635 fx License #01518883 |
Headquarters: 468 N. Canon Drive Beverly Hills, CA 90210 |
Credits
Powered by WordPress
Design by Graph Paper Press
Subscribe to entries
Subscribe to comments
2026 by Drew de la Houssaye – Realtor ©